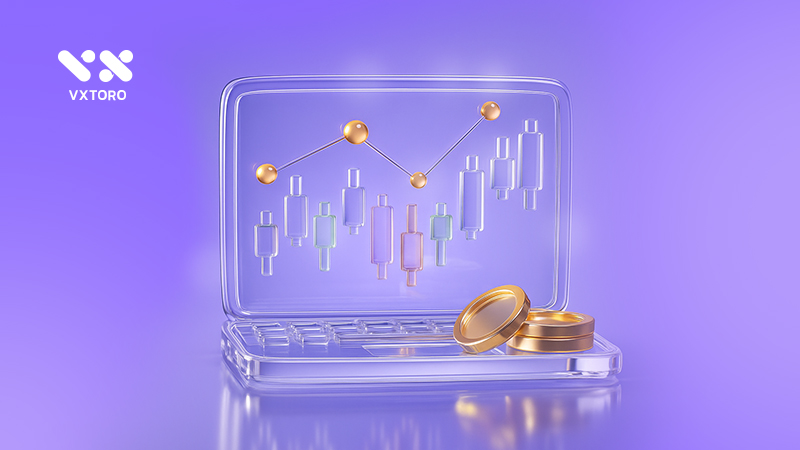
Every trader and investor in financial markets like forex and cryptocurrency has a special use of candlestick charts. This tool came from Japan in the 18th century, that have many types of uses. In the meantime, these charts provide a visual representation of price movements over a specified time period that will combine both price and volume information into a single format. In the continuation from the VXTORO exchange, we will discuss about types of Candlestick trading charts.
What are candlestick charts?

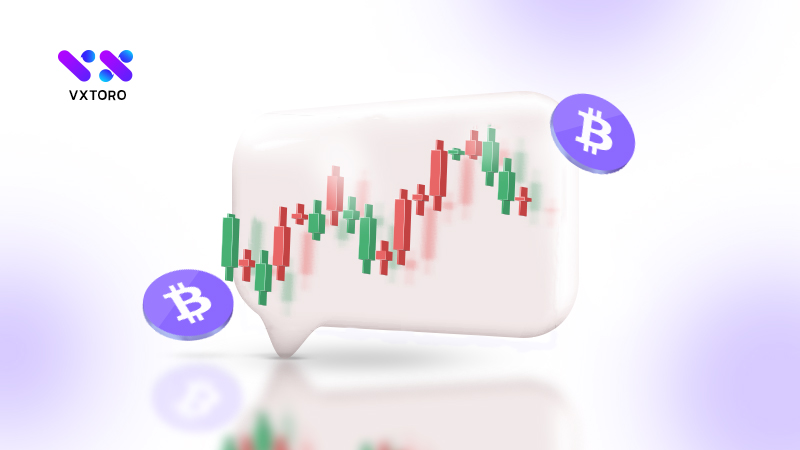
Candlestick charts have been called a popular financial charting technique used to represent price movements of securities. Also, traders use these charts for cryptocurrencies and commodities, and so many more to know the specific asset price at the time. In the meantime, Candlestick trading charts provide a visual representation of four key price points, like open, high, low, and close prices, within that timeframe. But A typical candlestick consists of a body and wicks. The body is for the range between the opening and closing prices. So, if the closing price is higher than the opening price, then the body section is colored green.
On the other hand, if the closing price is lower than the opening price, the body is colored red. Also, Candlestick charts are favored by traders for their ability to convey more information than traditional line charts. It’s worth saying that they allow traders to quickly assess market sentiment and potential price reversals or continuations. But Various patterns formed by multiple candlesticks can signal trends or possible market movements. These patterns as named DOJI and hammer.
Types of candlestick charts
There are several types of candlestick patterns that can signal potential market trends or reversals. Each of them represents the specific movement of the market. Below, we mention some of the types of Candlestick charts.
Bullish Candlesticks
These are usually defined by a green or white body that signifies that the closing price exceeds the opening price. Also, A long-bodied bullish candlestick indicates high buying pressure in a situation where the short-bodied one could reflect uncertainty among traders.
Single Candlestick Patterns
Single candlestick patterns are the simplest forms of candlestick analysis. They consist of one candlestick and can indicate potential market reversals. Below, we mention some of the single Candlestick charts.
- Doji
A doji candle reveals when the open and close prices are nearly equal. This will result in a very small body. Also, this pattern suggests indecision in the market and may indicate a potential reversal.
- Hammer
This Candlestick trading charts pattern has a small body at the upper end of the trading range and a long lower wick. In the meantime, it appears after a downtrend and indicates that buyers may be gaining strength.
- Shooting Star
The shooting star has a small body at the lower end of the trading range with a long upper wick. It follows a period of rising prices and indicates that sellers might be gaining influence.
Double Candlestick Patterns
Double Candlestick charts are made up of two sequential candlesticks and typically offer more reliable signals than individual patterns. Also, they can suggest possible reversals or continuations depending on the interaction between the two candles. Significant double candlestick patterns are included in the continuation.
- Bullish Engulfing
This formation appears when a tiny bearish candlestick is succeeded by a bigger bullish candlestick that entirely encompasses it. It’s worth saying that this indicates a possible shift from bearish to bullish sentiment.
- Bearish Engulfing
The reverse of the bullish engulfing Candlestick charts. This pattern takes place when a small bullish candlestick is succeeded by a larger bearish candlestick. Also, it suggests a possible shift from bullish to bearish sentiment.
Triple Candlestick Patterns
Triple candlestick patterns consist of three successive candles and offer deeper insights into market sentiment. In the meantime, among the notable triple candlestick patterns are the morning star, a reversal pattern that consists of two candles. Also, these bullish types are bearish candles and small-bodied candles. In the continuation, it indicates a potential shift from bearish to bullish momentum.
Also, the evening star represents the contrary of the morning star and indicates a potential bearish reversal. Also, it is composed of three Candlestick charts, named a rising candle followed by a declining candle that closes beneath the midpoint of the base candle.
Complex Candlestick Patterns
In addition to single, double, and triple formations, there exist more sophisticated patterns that merge several candles to express complex market behaviors. Examples of these include the Head and Shoulders pattern that may indicate potential reversals and Triangles. These features of Candlestick trading charts will frequently suggest continuation trends.
Best type of candlestick charts
One of the best types of Candlestick charts is the Japanese candlestick. Also, this type of chart is preferred for its effectiveness in communicating market sentiment. But doji and hammer patterns are the best, too. The Doji signifies indecision in the market, often leading to a reversal. But the Hammer pattern indicates potential bullish reversals after a downtrend. In the meantime, combining candlesticks with other technical indicators like moving averages or volume analysis can enhance their predictive power.
In the continuation, Japanese Candlestick trading charts are one of the most effective methods for examining price shifts because of their detailed information and capacity to reflect market sentiment. Also, by recognizing different patterns and combining them with additional analytical methods, traders can enhance their likelihood of success in the ever-changing financial markets.
Conclusion
In this article from VXTORO exchanger, we discussed Candlestick charts. Also, we talked about the best types of Candlestick trading charts, too. Candlestick charts are the best tools for traders aiming to grasp market sentiment and make well-informed choices. In the meantime, by identifying different candlestick patterns, traders can spot possible reversals or continuations in price movements. This feature allows for more strategic entry and exit points in their trading strategies. At the end, if you want to know more about the latest top cryptocurrency market trends and news, you can read our latest article, named PayPal expands PYUSD into stablechain ecosystem.
Frequently asked questions
- What is a candlestick chart?
A candlestick chart is a form of financial representation utilized to depict the price fluctuations of an asset during a particular timeframe.
- What do the colors of candlesticks indicate?
A green Candlestick charts indicates that the closing price is higher than the opening price (bullish).
- How can I use candlestick patterns in trading?
Market participants analyze candlestick formations to spot possible reversals or continuations in the market.